
Predicting Energy Efficiency of Buildings using LightGBM
Since I started working, I haven’t had much time to do kaggle competitions. However, competing in kaggle is a great way to stay in form (in terms of data science skills, of course) and to try out new techniques. Therefore, I set myself the goal of joining a competition this week and to try out a new model.
Contents
The competition
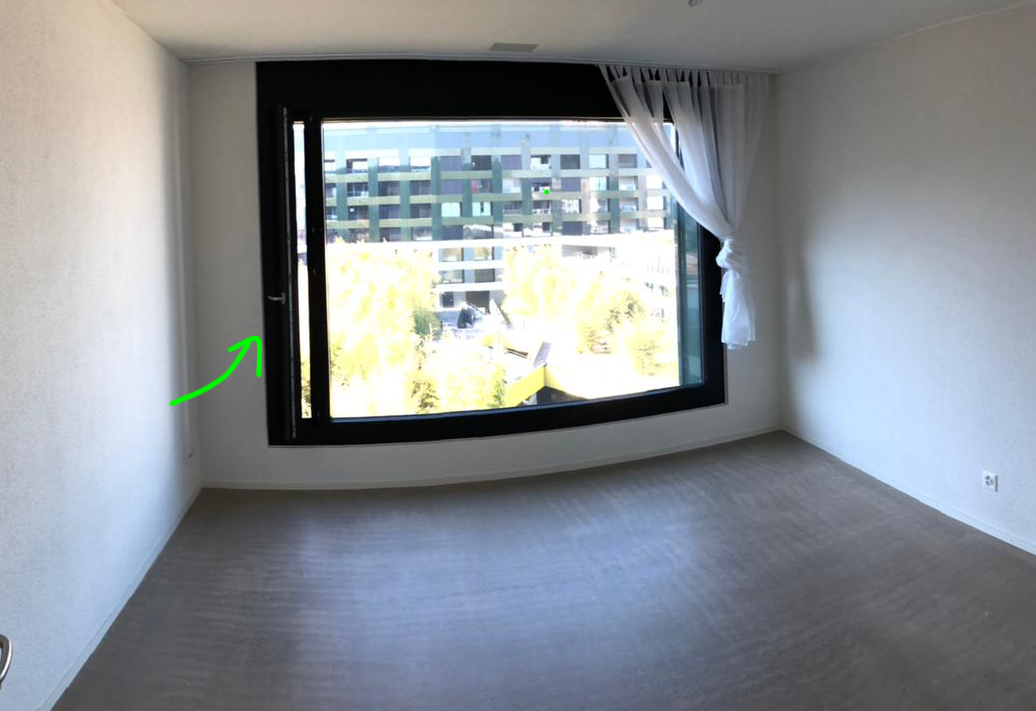
I have previously competed in several competitions based on image segmentation or some form of image analysis. This time, I wanted to try a dataset with tabular data. “ASHRAE - Great Energy Predictor III” seemed like a great fit. Furthermore, I recently learned about the Minergie standard of building houses in Switzerland. This standard defines several building techniques and materials that need to be considered so that the house is isolated and becomes more energy efficient. The current flat that I am renting is built using this standard and it has some “interesting” features such as the windows (see picture), one can open only a small slit on the side of the window to reduce energy loss. If you want to read more about Minergie, click here.
The Data
The dataset contains several measurements from sensors placed in different kinds of buildings, and the goal is to predict the energy efficiency of a building.
The data contains information about the weather in quite a bit of detail, values like air pressure and dew temperature are also present. Regarding the building data, it seems to be more limited as there is only information about its primary use (education, residential etc.), square feet, floor count and year that the building was built. Furthermore, an important aspect of this dataset is that there can be more than one meter (a device that measures energy consumption in kW/h) in a building. This means, that we can measure energy efficiency multiple times within the same building.
Here is a summary of the data:
train.csv
Data that’s coming from the building
- buildingid - Foreign key for the building metadata.
- meter - The meter id code. Read as {0: electricity, 1: chilledwater, 2: steam, 3: hotwater}. Not every building has all meter types.
- timestamp - When the measurement was taken
- meterreading - The target variable (the y we wish to predict). Energy consumption in kWh (or equivalent).
buildingmeta.csv
- siteid - Foreign key for the weather files.
- buildingid - Foreign key for training.csv
- primaryuse - Indicator of the primary category of activities for the building based on EnergyStar property type definitions
- squarefeet - Gross floor area of the building
- yearbuilt - Year building was opened
- floorcount - Number of floors of the building
weather[train/test].csv
Weather data from a meteorological station as close as possible to the site.
- siteid
- airtemperature - Degrees Celsius
- cloudcoverage - Portion of the sky covered in clouds, in oktas
- dewtemperature - Degrees Celsius
- precipdepth1hr - Millimeters
- sealevelpressure - Millibar/hectopascals
- winddirection - Compass direction (0-360)
- windspeed - Meters per second
test.csv
The submission files use row numbers for ID codes in order to save space on the file uploads. test.csv has no feature data; it exists so you can get your predictions into the correct order.
- rowid - Row id for your submission file
- buildingid - Building id code
- meter - The meter id code
- timestamp - Timestamps for the test data period
Do we need all of these dimensions? Are there latent variables that we can extract from these observable variables? Let’s find out by doing some EDA.
Exploratory Data Analysis
Let’s analyse some of the columns that we have available. First, how many floors do these buildings have?
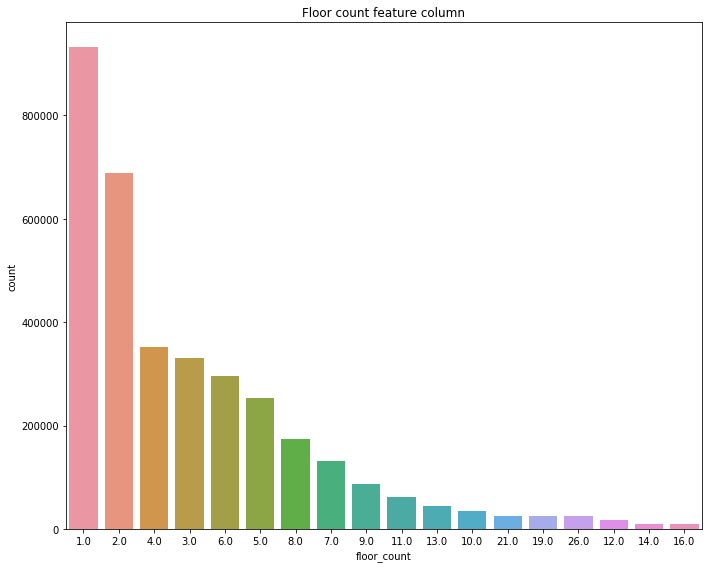
Turns out that the dataset is mainly composed of single-floored or double-floored buildings. Good, now what about the purpose of the building?
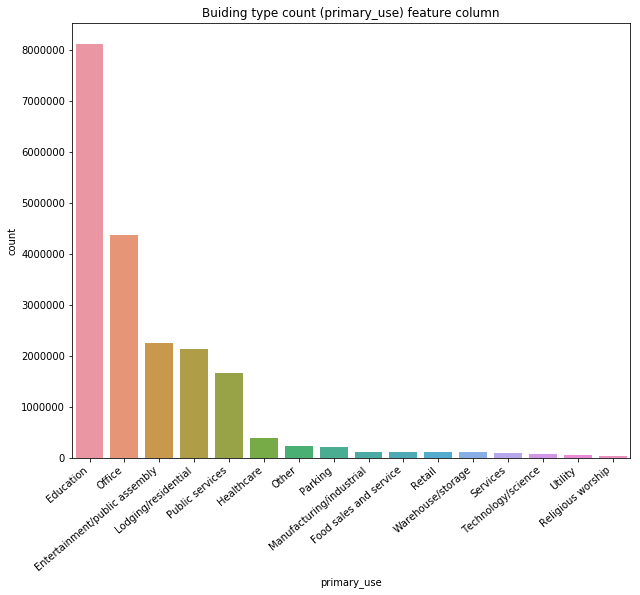
Mainly schools and offices. Alright, these two type of buildings usually share the same type of properties. A/C or heating probably for a constant temperature all year around. What about the temperature outside?
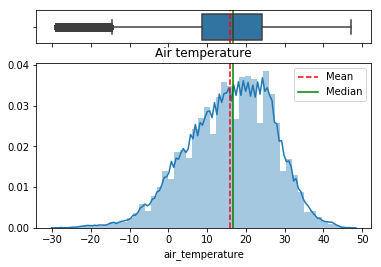
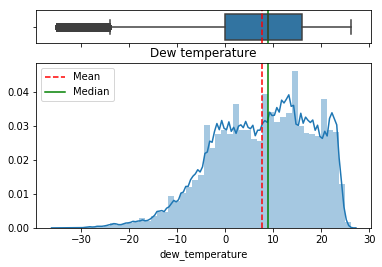
Interesting. The dataset does not say where these buildings are located, but looking at the temperature data we can come to the following conclusions (credits to kaggle user sdoria):
In the histogram of air temperatures, bins 9,14,19,24,29,34 have fewer records than expected.
Looking deeper into it, it seems that this is because some of the temperature values have been converted from F to ºC.
For example:
- 56F = 13.3C
- 57F = 13.9C
- 58F = 14.4C
From the examples above, I hope you can see why the 14 bin has fewer records than the 13 or 15 bins. So, for a lot of the temperature data, we have 0.5 or 0.6 jumps depending on rounding.
Furthermore site id 7 and 11 are in Celsius, and appears to have a 3 day long weekend with lower power usage that includes Friday, July 1st. Canada day?
Within the same building, the readings can be quite different as we can observe from the following graph.
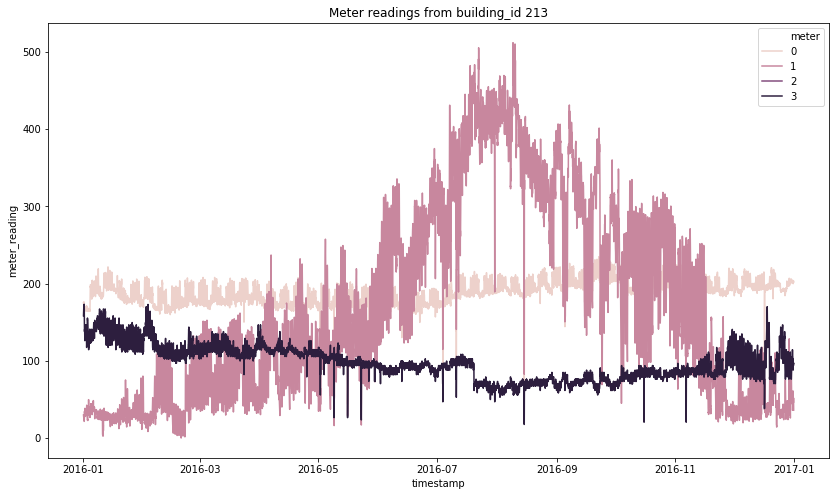
From these readings, we can see how some of the meters are probably measuring some sort of cooling system whereas the others aren’t (meter 1 vs meter 4 for example).
LightGBM
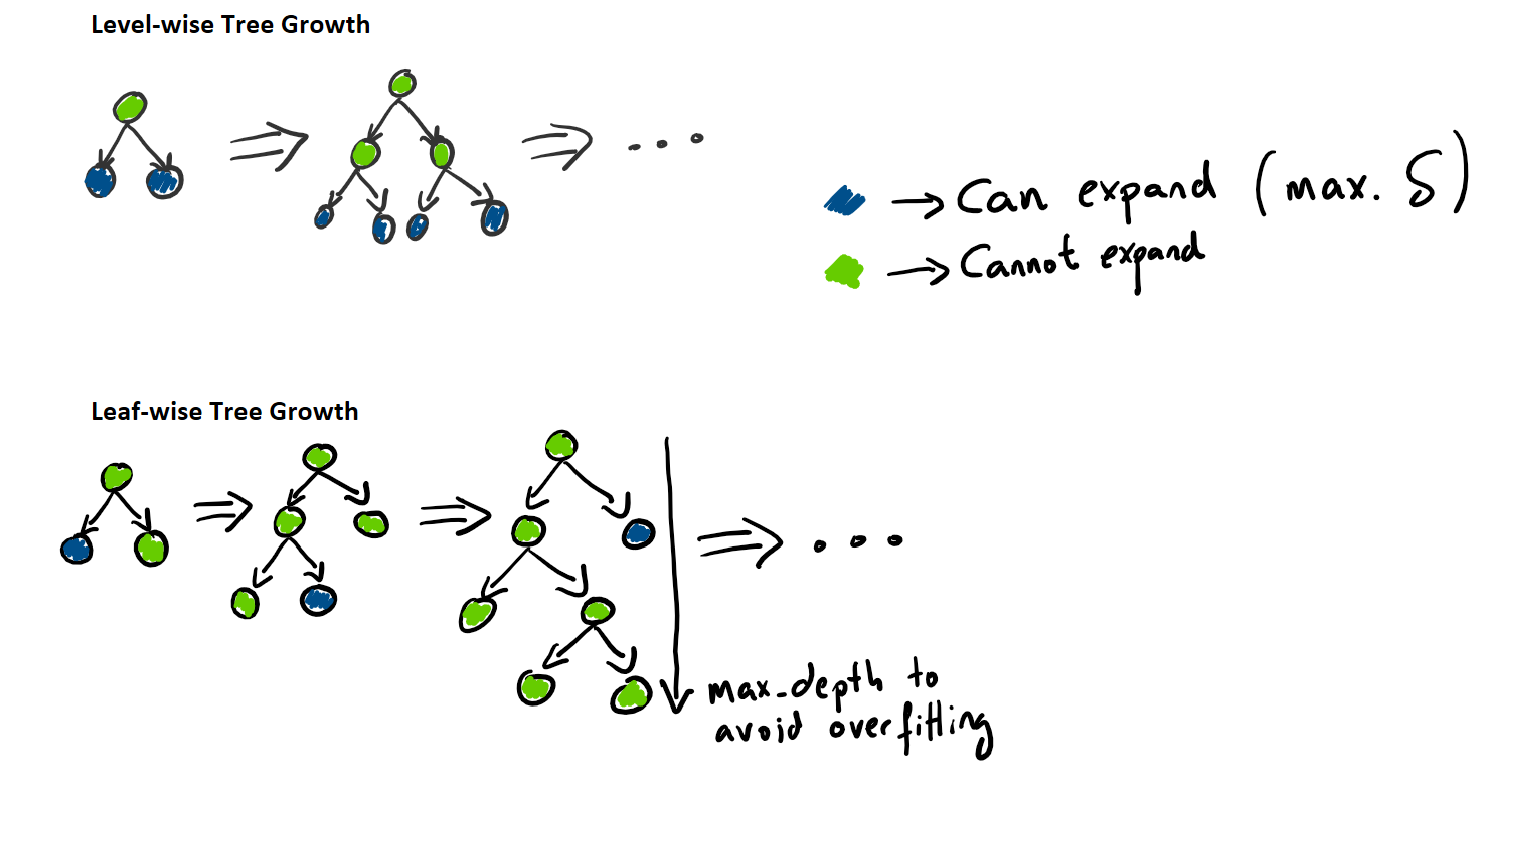
The model that we will use to create a prediction will be LightGBM. LightGBM, introduced by Microsoft, is a gradient boosting framework that uses a tree based learning algorithm introduced in 2017. It is said to be quicker than other tree based methods because it grows the tree vertically (depth). It will choose a leaf to grow (leaf-wise growing) with max delta loss.
Furthermore, it is popular is because it focuses on accuracy of results and handles large amounts of data better than other methods. LightGBM introduces two techniques that gives it the speed and the lightness: Gradient-based One-Side Sampling (GOSS) and Exclusive Feature Bundling (EFB). If you wish to learn more about these techniques, I would recommend to read the original paper (link is in the reference section).
The following diagram visually explains the difference in how to grow a tree compared to traditional tree learning methods.
The following properties make LightGBM a great candidate for quick kaggle projects:
- Faster training speed and higher efficiency.
- Lower memory usage.
- Better accuracy.
- Support of parallel and GPU learning.
- Capable of handling large-scale data.
The Pipeline
Now that we have selected a model and we understand the data, let’s set up an architecture to solve the problem. As the data comes separated in different csv files, we will need to join these values. Furthermore, data cleaning will also need to be done as there are several missing values and outliers.
To train the model, we will perform an ordinary 80% 20% data split to train/validate our model. Nothing fancy here. Furthermore, as the main goal of this challenge is speed and being able to compete minimising time invested, hyperparameters were chosen based on recommended values. I expect that LightGBM will do well enough without the need to fine-tune the hyperparameters.
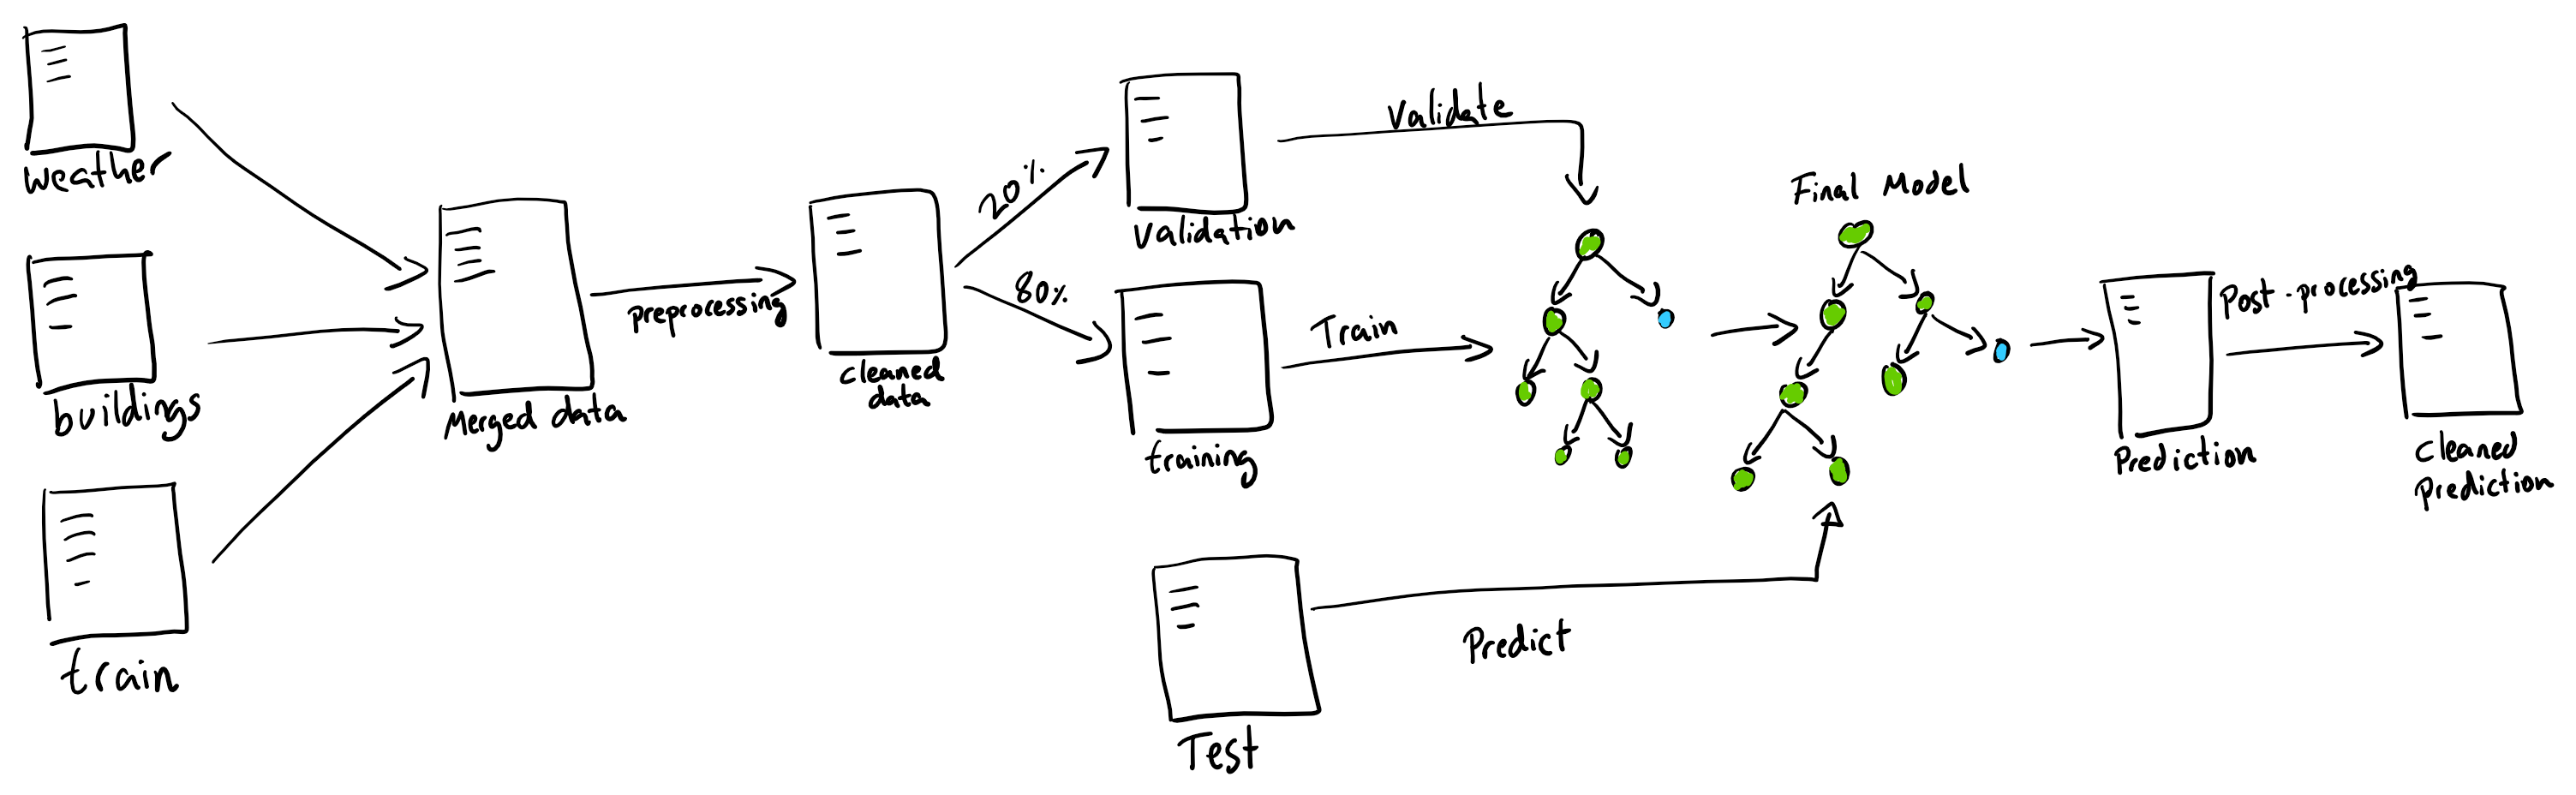
Some post-processing is also necessary, as some predictions contain negative values. These negative values are mapped to zero consumption.
Results
After training the model for about an hour, the results were surprisingly good. With minimal effort and almost no preprocessing, we achieved a validation RMSLE of 0.189. Furthermore, after submitting the results, the result was a score of 1.39, which at the time of submission put us in the top 23% of the public leaderboard. Not bad!
Conclusion
Using a novel gradient boosting technique, we have achieved fast robust results with minimal preprocessing. One of its biggest issue, however, is overfitting.
Also we can observe that it is quite easy to overfit the model. Perhaps changing the max depth would have given better results.
If you wish to work with the notebook I used to perform this analysis, download it here.
References
-
LightGBM: paper
-
Kaggle user: sdoria
-
What is LightGBM?: medium post